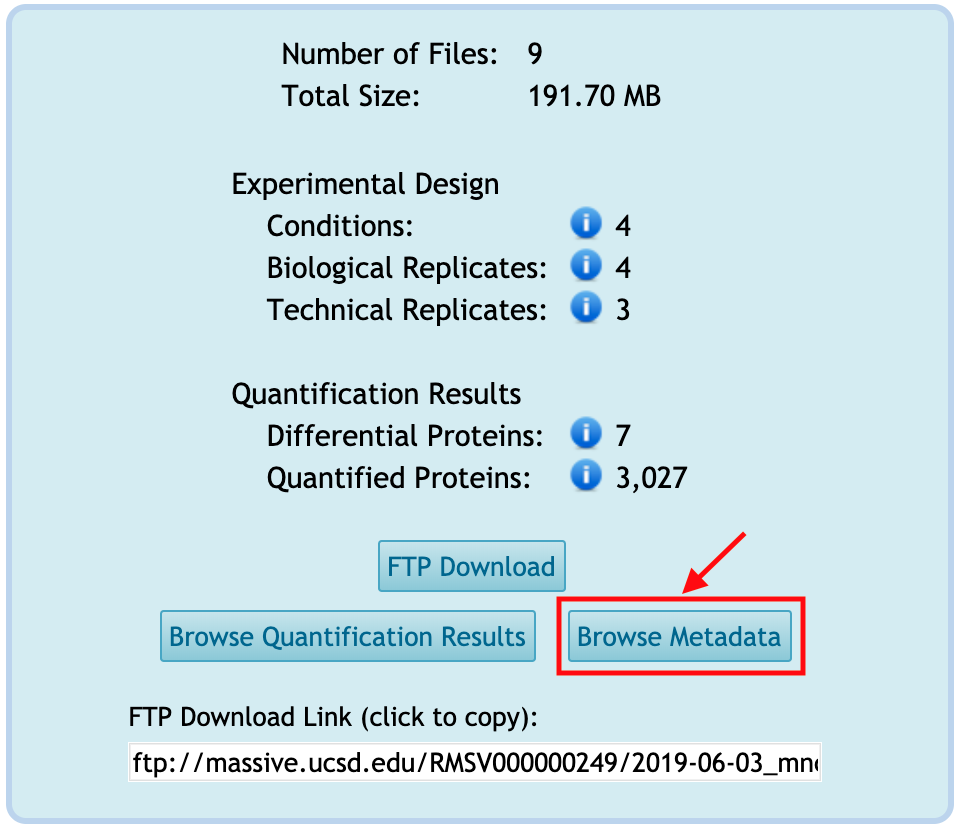
Browse Metadata
You can browse the metadata for the reanalysis by clicking on Browse Metadata from the reanalysis webpage. This button is activated only when any tabular-type file(s) is available in the Metadata category.
You will move to the new webpage to show the list of files under the Metadata category.
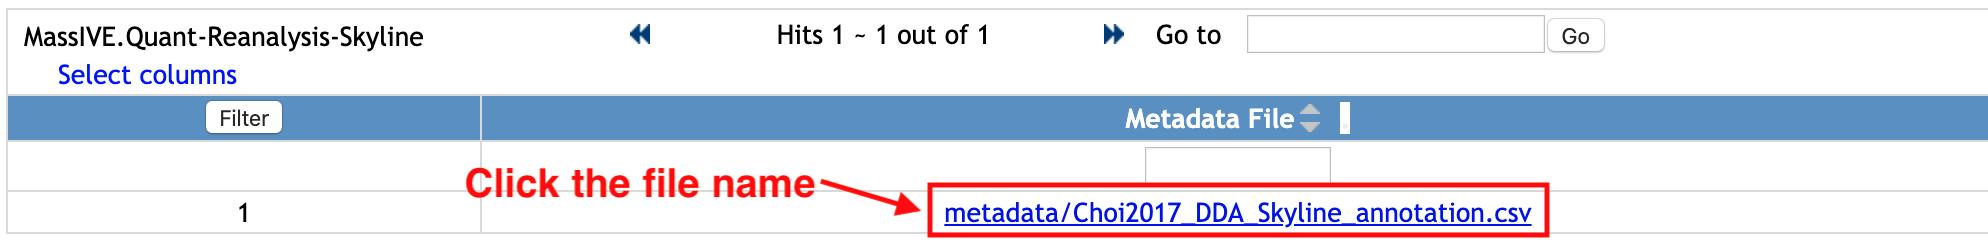
Select one file name and it will show how the file looks. This is the example of an annotation file for MSstats, which requires Run or Raw.file, Condition, BioReplicate. It can have many additional columns.
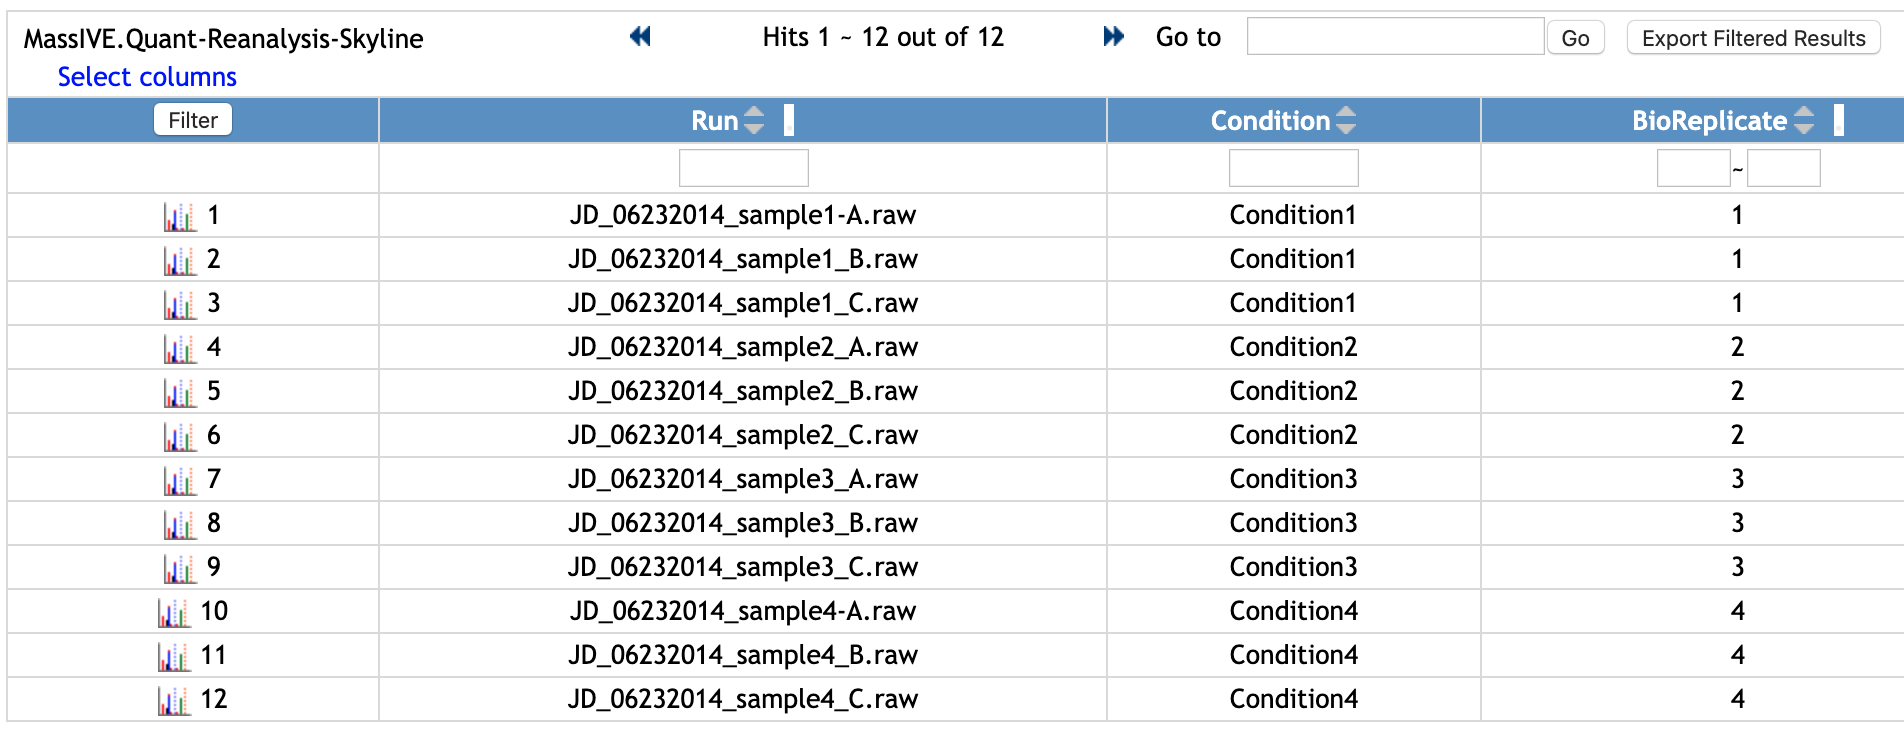
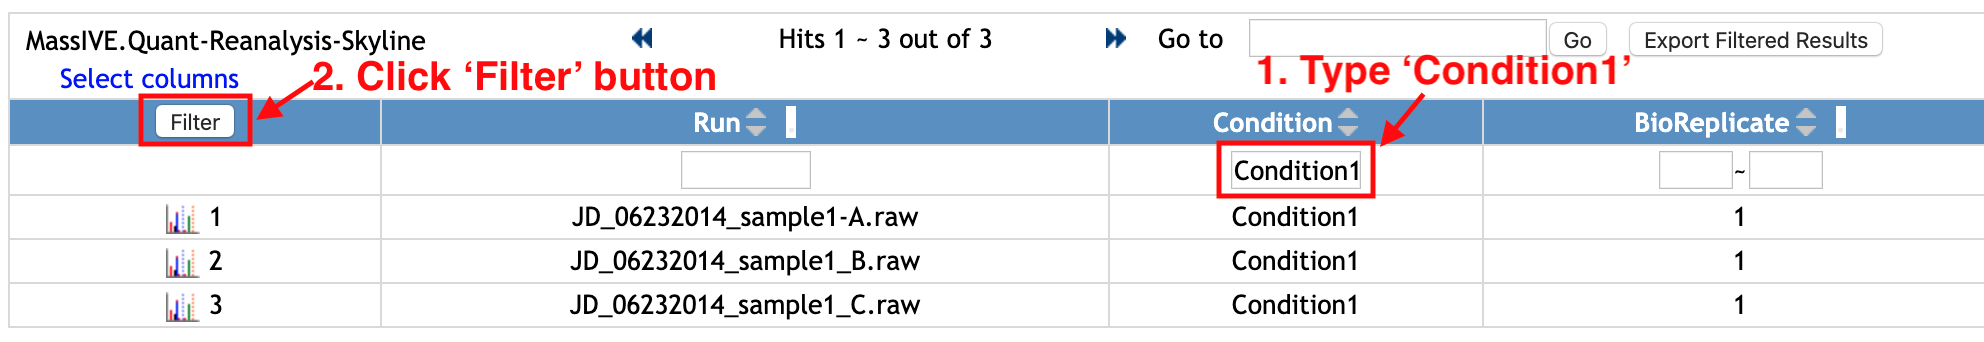
You can filter the rows. Let's check the rows for 'Condition1'.
- Type 'Condition1' in the empty box in the first row and below the column named 'Condition'.
- Click
Filterbutton at the top left of the table.
Then, the rows with 'Condition1' for Condition column are shown. For this example, there are three Runs from 'Condition1'.
If you want to remove the filter and to see the whole table, remove 'Condition1' that you typed and click the same Filter button again.
!! Note: Run and Raw.file are identical in most datasets. However, if Run information in quantification files are different than the name of raw files, we recommend to provide both Run and Raw.file in the Metadata. Raw.file refers to the name of .raw file in the original submission of dataset. Run refers to MS run ID in the quantification files.
Browse Quantification Results
You can browse the quantification results for the reanalysis by clicking on Browse Quantification Results from the reanalysis webpage. This button is activated only when any tabular-type file(s) is available in the Quantification Results or Statistical Analysis of Quantified Analytes categories.
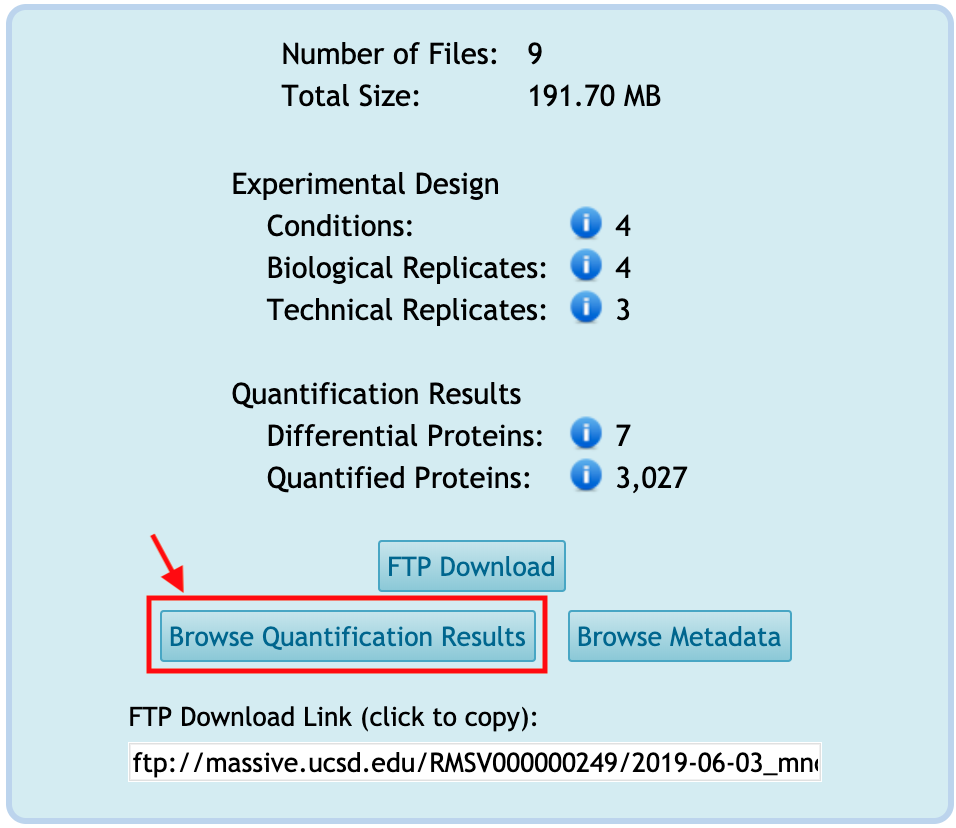
You will move to the new webpage to show the list of files under the Quantification Results or Statistical Analysis of Quantified Analytes categories.
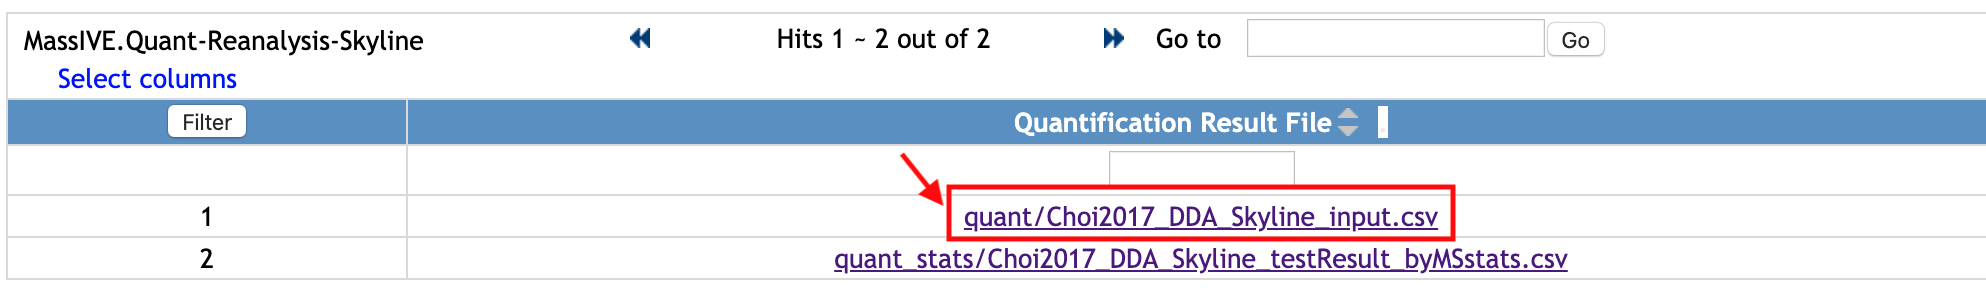
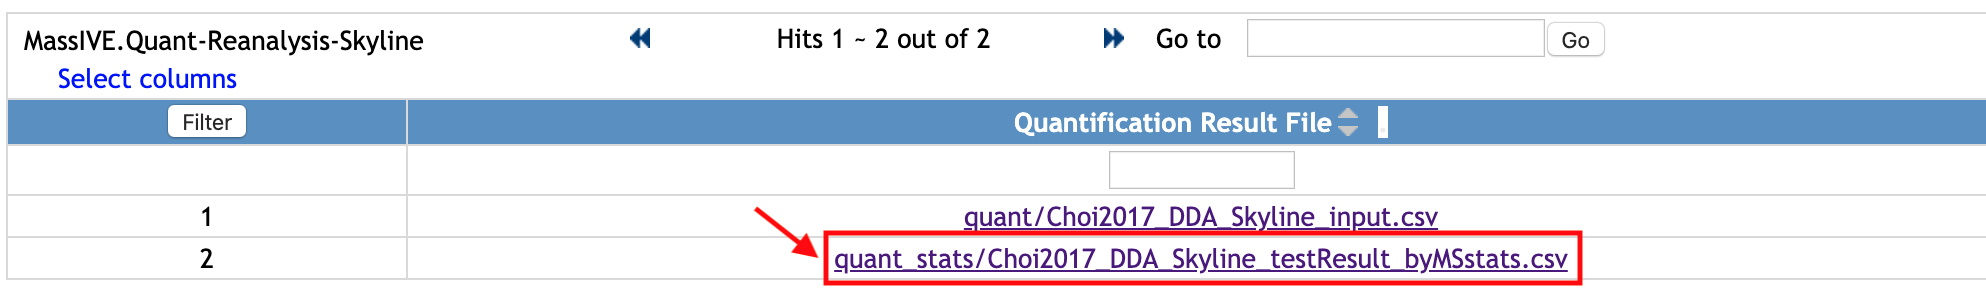
Select one file, named quant/Choi2017_DDA_Skyline_input.csv. This file was submmited to the Quantification Results.
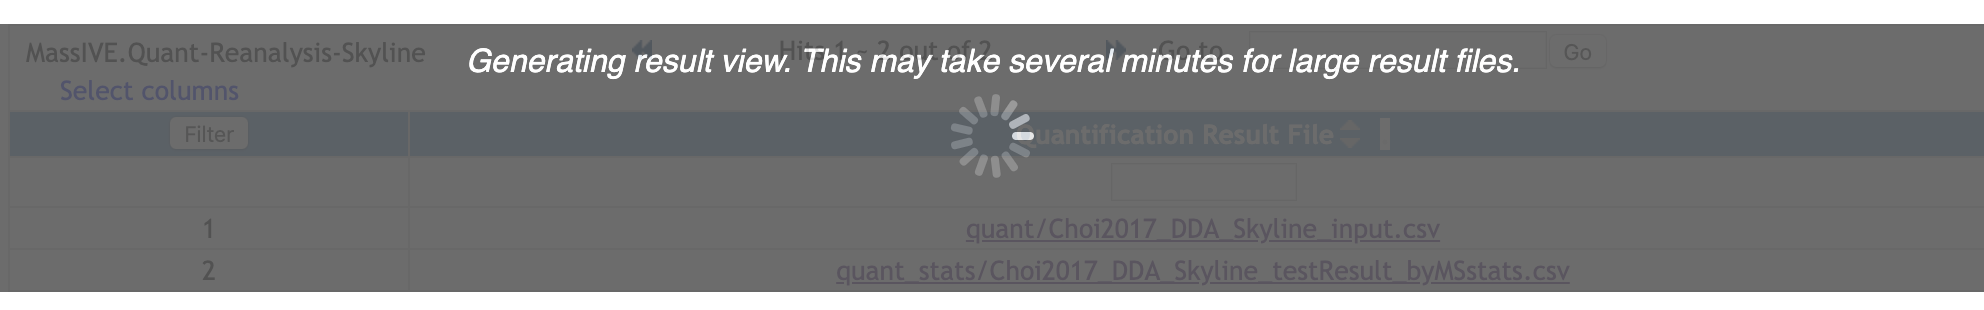
Note: The file size of the quantification result could be big. If the webpage shows like below, please wait for little more.
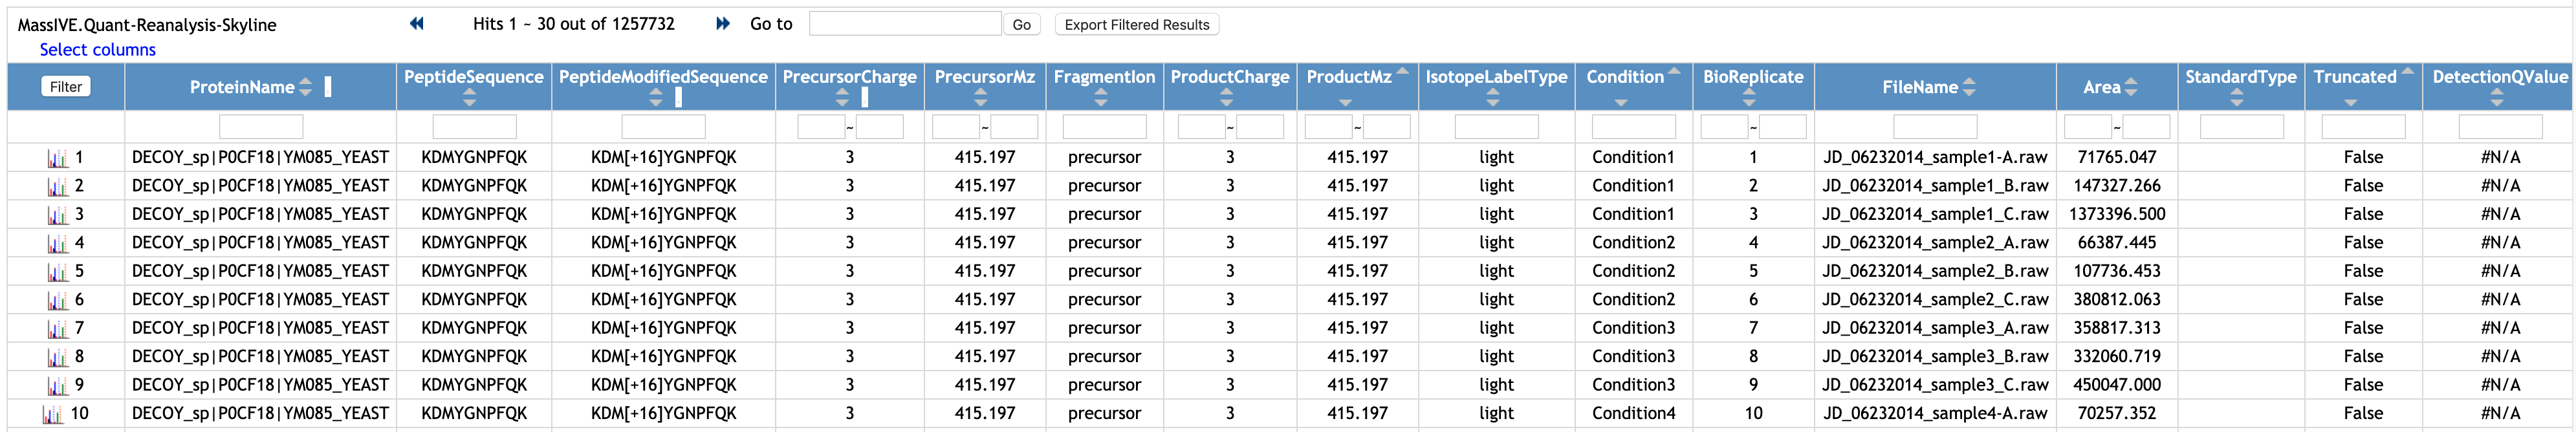
This is the example of the quantification result (MSstats reports) from Skyline.
Let's see another file. Select one file, named quant_stats/Choi2017_DDA_Skyline_testResult_byMSstats.csv. This file was submitted to Statistical Analysis of Quantified Analytes.
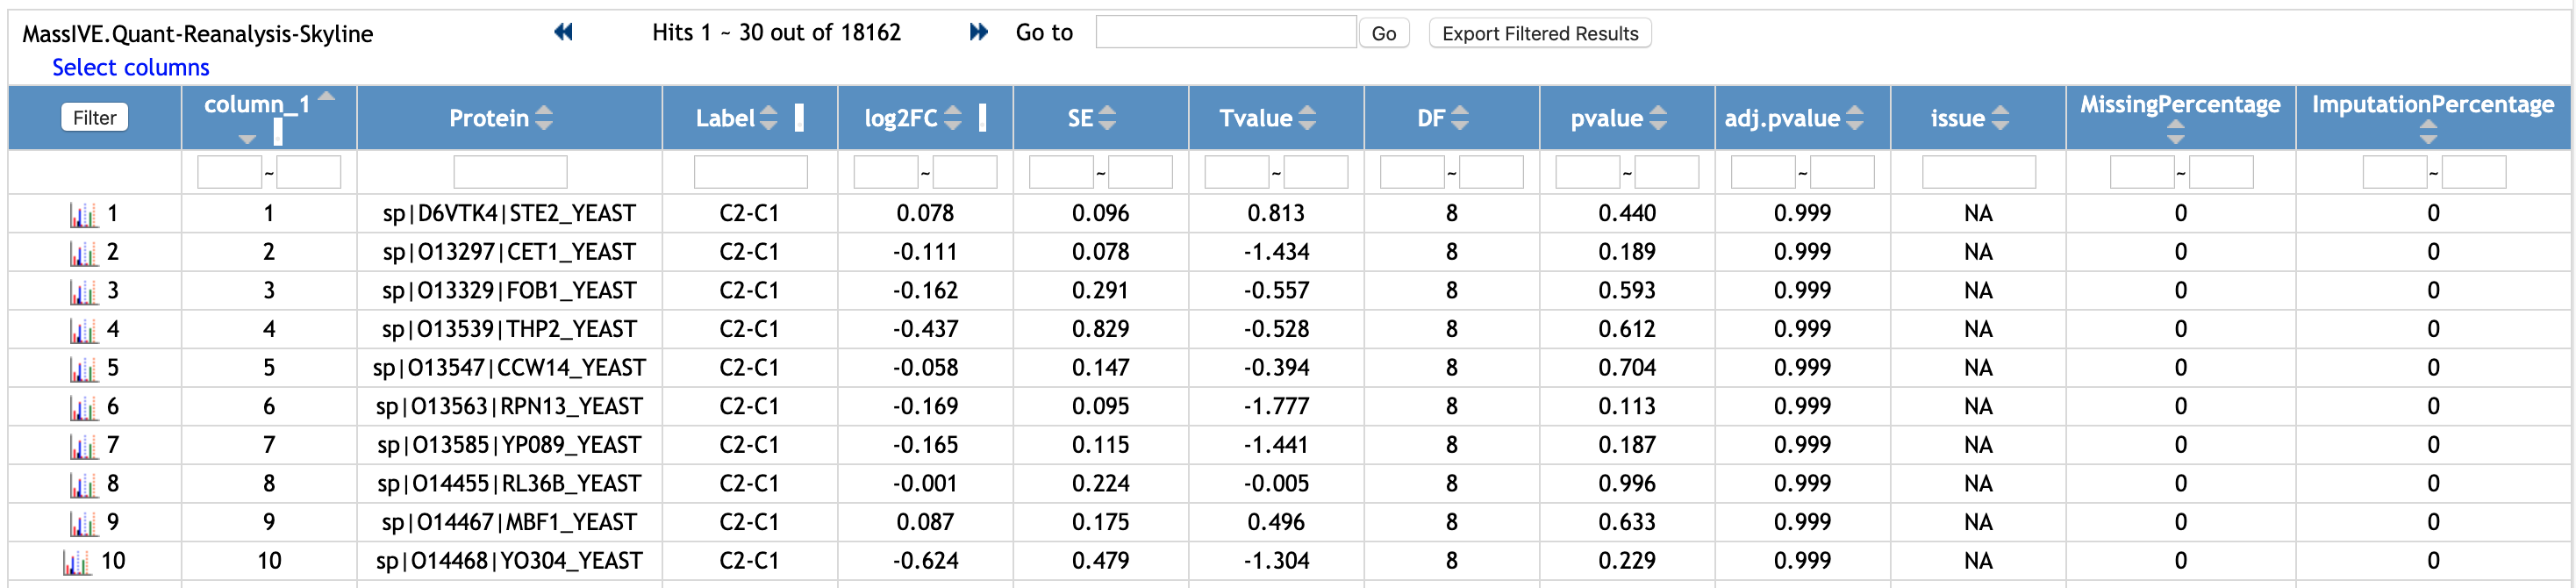
This is the example of the output of MSstats, using the quantification result from Skyline (named Choi2017_DDA_Skyline_input.csv, the file shown above).
You can filter the rows. Let's check the rows for a protein named 'sp|D6VTK4|STE2_YEAST'.
- Type 'sp|D6VTK4|STE2_YEAST' in the empty box in the first row and below the column named 'Protein'.
- Click the
Filterbutton at the top left of the table.
Then, the rows with 'sp|D6VTK4|STE2_YEAST' for the Protein column are shown. There are six rows with different Label, which shows different pairwise comparisons. The user can customize the names of comparisons, which are shown in the Label, in MSstats. It can be different than the values of Condition in the annotation file.
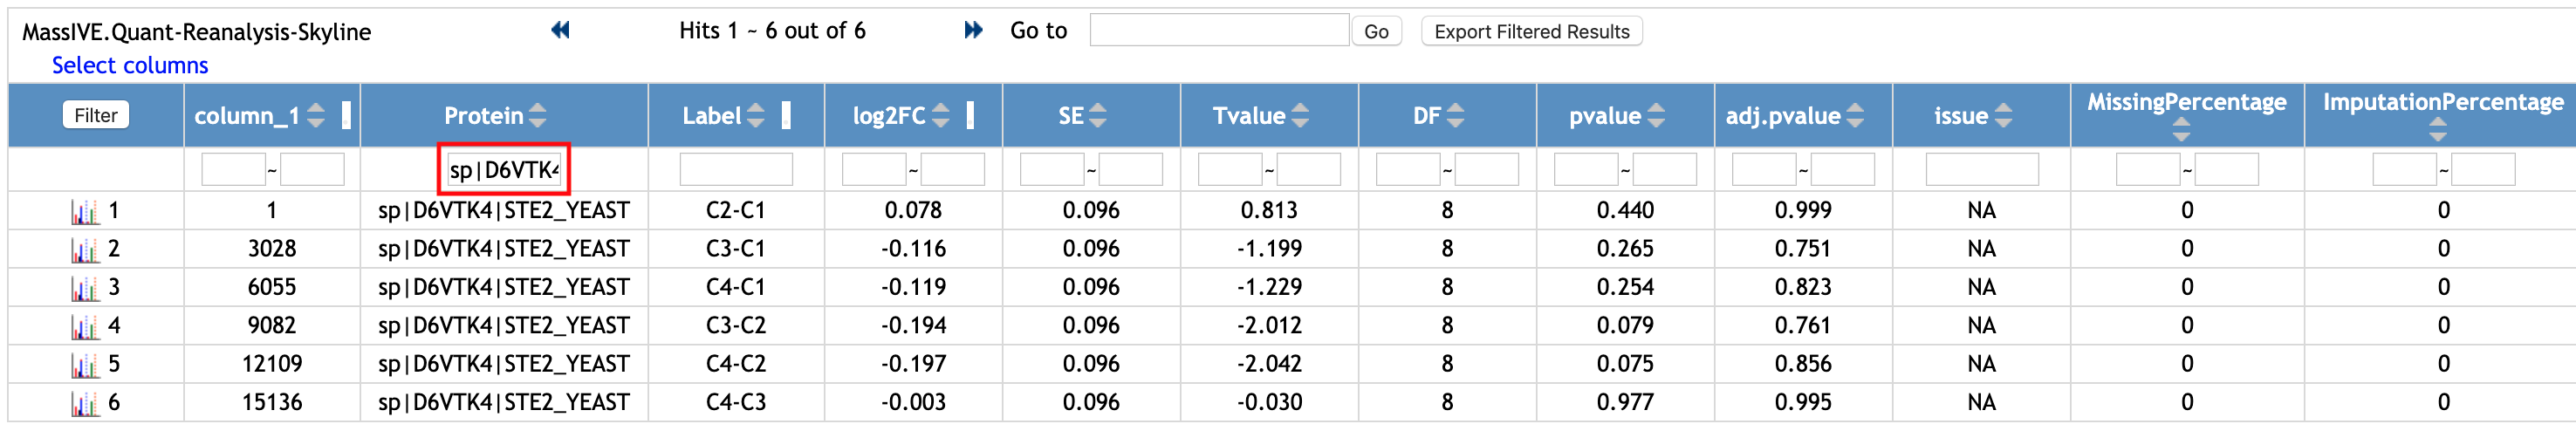
If you want to remove the filter and to see the whole table, remove 'sp|D6VTK4|STE2_YEAST' that you typed and click the same Filter button again.
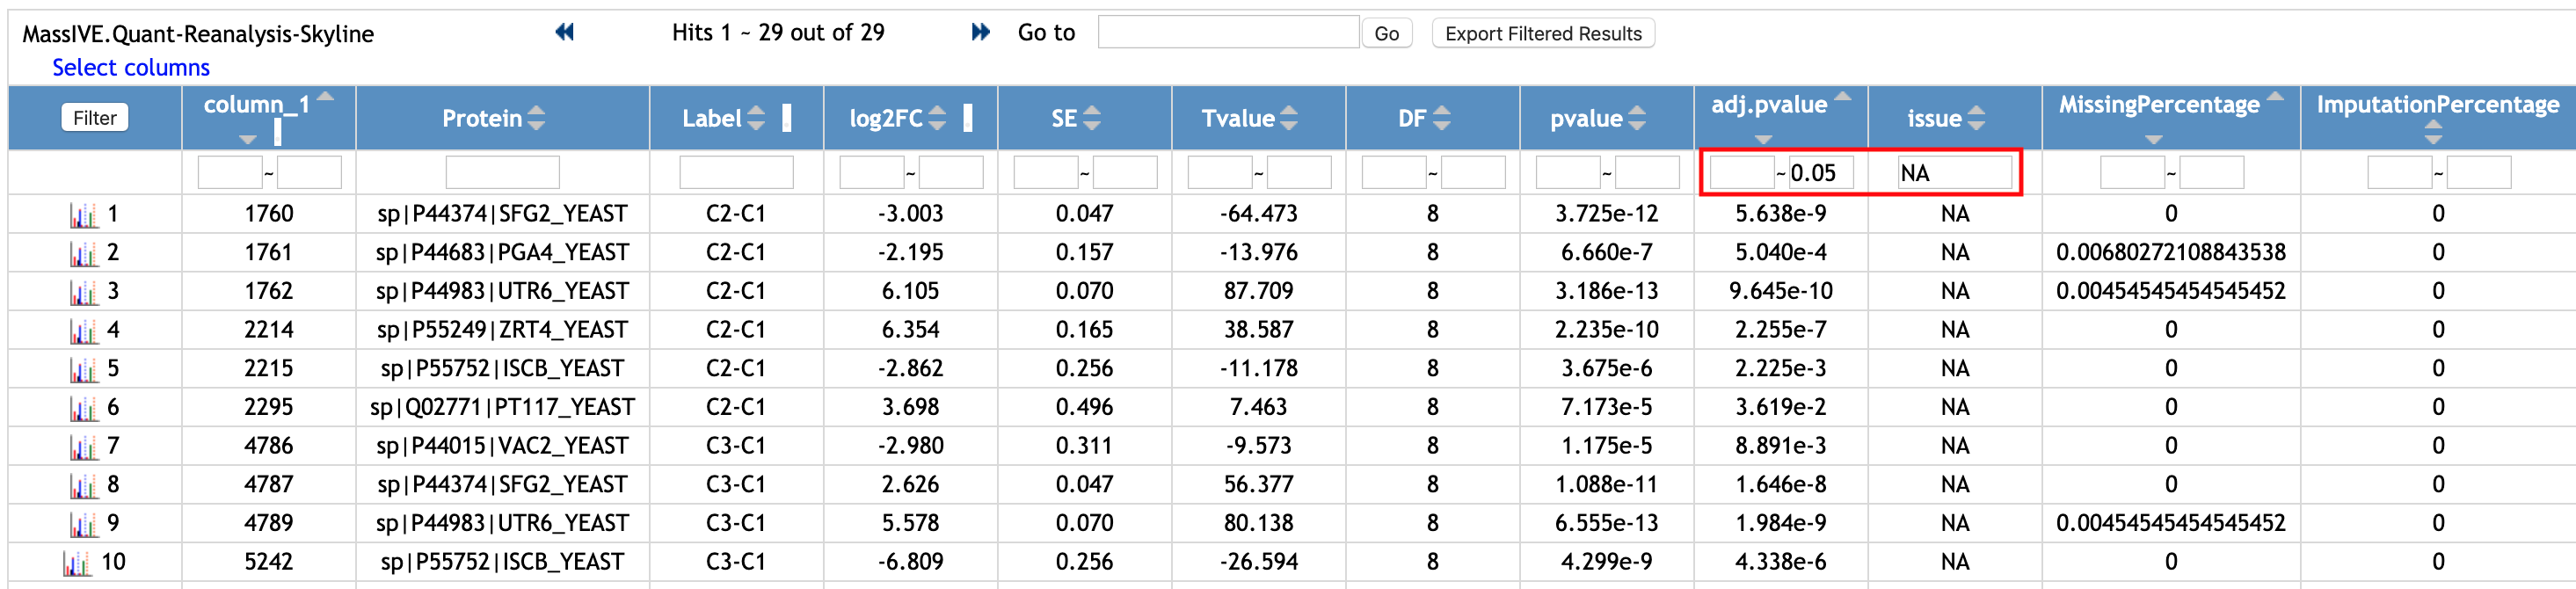
Let's check the rows with significantly different proteins and comparisons.
- Type '0.5' in the second empty box in the first row and below the column named 'adj.pvalue'.
- Type 'NA' in the empty box in the first row and below the column named 'issue'.
- Click the
Filterbutton at the top left of the table.
Then, the rows with significantly differential abundunce are shown. There are 29 rows shown. Among 29 rows, there are 7 unique proteins.